Introduction: STEM vs STEAM
📚 Understanding the Difference
STEM: Science, Technology, Engineering, Mathematics
STEAM: Science, Technology, Engineering, Art, Mathematics
Why add Art? According to Maeda (2013), Art develops creativity, design thinking, and innovation—critical skills for 21st-century careers. The integration of artistic thinking into technical fields produces more innovative problem-solvers.
Traditional vs STEM Integration: A Comparison
❌ Traditional Science Approach - Limited Impact
Lesson: Learn about bridges
Activity: Read textbook, define suspension bridge
Assessment: Define terms on worksheet
Problem: No hands-on application—abstract knowledge only, disconnected from real-world application
✅ STEM Integration Approach - Deep Learning
Lesson: Learn about bridges
Activity Sequence:
- Read about bridge types (worksheet documentation)
- Design own bridge (drawing and planning)
- Build with materials (hands-on construction)
- Test weight capacity (scientific experiment)
- Redesign to improve (engineering iteration)
Assessment: Explain design choices through written reflection
Result: Deep understanding through DO-ing—students connect theory to practice
💡 Key Principle
Worksheets SUPPORT hands-on learning, they don't replace it. The worksheet serves as documentation, planning tool, and reflection mechanism—enhancing the hands-on experience rather than substituting for it.
Engineering Design Process Worksheets
The Engineering Design Process is a systematic approach to problem-solving used by engineers worldwide. It consists of five iterative steps:
The 5-Step Engineering Design Process
- Ask - Identify the problem and constraints
- Imagine - Brainstorm multiple solutions
- Plan - Choose the best idea and design it
- Create - Build a prototype
- Improve - Test, iterate, and redesign
Engineering Design Worksheet Template
ENGINEERING DESIGN CHALLENGE: Build a bridge that holds 100 pennies

STEP 1: ASK (Identify the problem)
What is the challenge? ________________________________
What constraints do we have? (materials, time, size)
_________________________________________________

STEP 2: IMAGINE (Brainstorm solutions)
Sketch 3 different bridge designs:
[Drawing box 1]    [Drawing box 2]    [Drawing box 3]

Which design will you choose? _____ Why? ___________
_________________________________________________

STEP 3: PLAN (Detailed design)
Draw your final design with labels:
[Large drawing box]

Materials needed:
☐ _____________  ☐ _____________  ☐ _____________

Predicted weight capacity: _____ pennies

STEP 4: CREATE (Build it!)
[Complete after building]
Building process notes: ___________________________
Challenges I faced: _______________________________

STEP 5: IMPROVE (Test & Redesign)
Actual weight capacity: _____ pennies
Did it meet the goal (100 pennies)? ☐ Yes ☐ No

If I built it again, I would change: _________________
_________________________________________________

What I learned: ____________________________________
✅ Generator Benefit
Create this template in 42 seconds with custom prompts and appropriate spacing—no more spending 30 minutes formatting a worksheet by hand!
Math Integration: Measurement & Data Collection
STEM projects provide authentic contexts for mathematical thinking. Students aren't just solving abstract problems—they're using math as a tool to understand real phenomena.
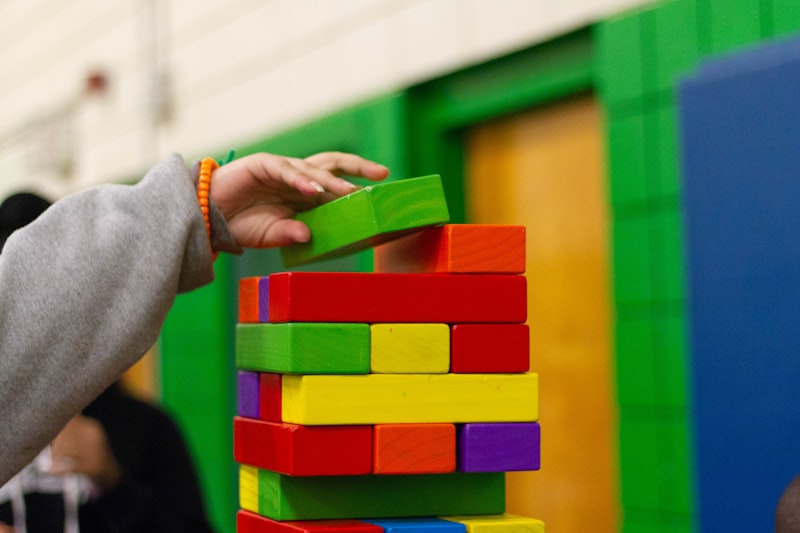
STEM Challenge: Build the Tallest Tower
Challenge: Build the tallest tower possible using 20 popsicle sticks
Tower Building: Data Collection

PRE-BUILD PREDICTION:
I predict my tower will be ____ cm tall.

BUILDING PHASE:
How many sticks did you use? ____
What shape is the base? (circle, square, triangle) ____

MEASUREMENT:
Actual height: ____ cm
Difference from prediction: ____ cm (taller or shorter?)

DATA ANALYSIS:
Measure 5 classmates' towers:

Student Name | Tower Height (cm) | Base Shape
-------------|------------------|------------
1.           |                  |
2.           |                  |
3.           |                  |
4.           |                  |
5.           |                  |

GRAPHING:
Create bar graph showing tower heights:
[Graph template with axis labels]

MATH QUESTIONS:
1. What was the tallest tower? ____ cm
2. What was the shortest tower? ____ cm
3. What is the difference? ____ cm
4. What is the average height? ____ cm (add all heights ÷ 5)
5. Which base shape was most common? ____________

ANALYSIS:
Does base shape affect tower height? (Support with data)
_________________________________________________
📊 Skills Integrated
- Measurement using metric units (cm)
- Data collection and organization
- Creating and interpreting bar graphs
- Calculating averages
- Data-driven analysis and conclusions
Science Integration: Hypothesis Testing
The scientific method is the foundation of scientific inquiry. STEM projects allow students to practice this process with tangible, engaging experiments.
STEM Challenge: Paper Airplane Experiment
Question: Which paper airplane design flies the farthest?
Paper Airplane Experiment

QUESTION: Which airplane design flies the farthest?

HYPOTHESIS:
I think the _____________ design will fly farthest because
_________________________________________________

MATERIALS:
☐ 3 sheets of paper (same size)
☐ Measuring tape
☐ Open space

PROCEDURE:
1. Fold 3 different airplane designs
2. Throw each airplane 3 times
3. Measure distance traveled (cm)
4. Record data in table

DATA COLLECTION:

Design A (Standard dart):
Trial 1: ____ cm  |  Trial 2: ____ cm  |  Trial 3: ____ cm
Average: ____ cm

Design B (Wide wings):
Trial 1: ____ cm  |  Trial 2: ____ cm  |  Trial 3: ____ cm
Average: ____ cm

Design C (Narrow):
Trial 1: ____ cm  |  Trial 2: ____ cm  |  Trial 3: ____ cm
Average: ____ cm

RESULTS:
Winner: Design ____ (average distance: ____ cm)

CONCLUSION:
Was your hypothesis correct? ☐ Yes ☐ No
Why do you think this design flew farthest?
_________________________________________________

SCIENTIFIC REASONING:
What forces affected the airplane? (gravity, air resistance)
_________________________________________________

How could you improve the winning design?
_________________________________________________
🔬 Skills Integrated
- Forming testable hypotheses
- Following experimental procedures
- Accurate measurement and data recording
- Calculating and comparing averages
- Understanding physics concepts (gravity, air resistance)
- Writing evidence-based conclusions
Technology Integration: Coding & Logic
Computational thinking doesn't require computers! "Unplugged" coding activities teach algorithmic thinking, sequencing, and debugging—foundational computer science concepts.
STEM Challenge: Algorithm Design
Algorithm Challenge: Give Directions to Find Treasure

GOAL: Write step-by-step instructions to guide someone from START
to TREASURE on the grid below.

[5×5 grid with START in bottom left, TREASURE in top right, obstacles marked]

PLANNING:
How many steps do you think you'll need? ____

WRITE YOUR ALGORITHM:
Use these commands only:
- FORWARD (move 1 square ahead)
- TURN RIGHT (turn 90° right)
- TURN LEFT (turn 90° left)

Step 1: ___________
Step 2: ___________
Step 3: ___________
Step 4: ___________
...

TEST YOUR CODE:
Trade papers with a partner. Have partner follow YOUR instructions.
Did they reach the treasure? ☐ Yes ☐ No

DEBUGGING:
If it didn't work, what went wrong? ____________________
How can you fix it? _________________________________

REVISED ALGORITHM (if needed):
Step 1: ___________
...

COMPUTER SCIENCE CONCEPT:
This activity teaches SEQUENCING: Steps must be in correct order,
or program fails.
💻 Skills Integrated
- Logical thinking and planning
- Sequential ordering (algorithms)
- Problem decomposition
- Debugging and iteration
- Persistence through challenges
- Clear, precise communication
Art Integration (STEAM): Aesthetics + Function
STEAM education recognizes that the best designs balance functionality with aesthetics. Engineers must consider both how things work AND how they look and feel to users.
STEAM Challenge: Product Design
Challenge: Create a pencil holder that is BOTH functional AND beautiful
Product Design Challenge: Create a pencil holder

FUNCTION REQUIREMENTS (Engineering):
☐ Must hold at least 10 pencils
☐ Must stand upright on desk
☐ Must be stable (not tip over)

AESTHETIC REQUIREMENTS (Art):
☐ Must have color (not plain)
☐ Must include a pattern or design
☐ Must be visually appealing

MATERIALS AVAILABLE:
Paper, cardboard, tape, glue, markers, scissors

DESIGN SKETCH:
[Drawing box for functional view]
Label important features (how does it stand up? how do pencils fit?)

ART DESIGN:
[Drawing box for aesthetic view]
What colors will you use? _______
What pattern/design? __________

BUILD & EVALUATE:

Functional test:
☐ Holds 10 pencils? (Yes/No)
☐ Stands upright? (Yes/No)
☐ Stable? (Yes/No)

Aesthetic evaluation:
☐ Colorful? (Yes/No)
☐ Has pattern/design? (Yes/No)
☐ Visually appealing? (Yes/No - ask 3 classmates to vote)

REFLECTION:
Which was harder: making it work, or making it beautiful? Why?
_________________________________________________

How did you balance function and art?
_________________________________________________
🎨 Skills Integrated
- Engineering (structural design and stability)
- Art (color theory, pattern design, aesthetics)
- Problem-solving (balancing competing requirements)
- Evaluation (testing against criteria)
- Critical thinking (reflection on process)
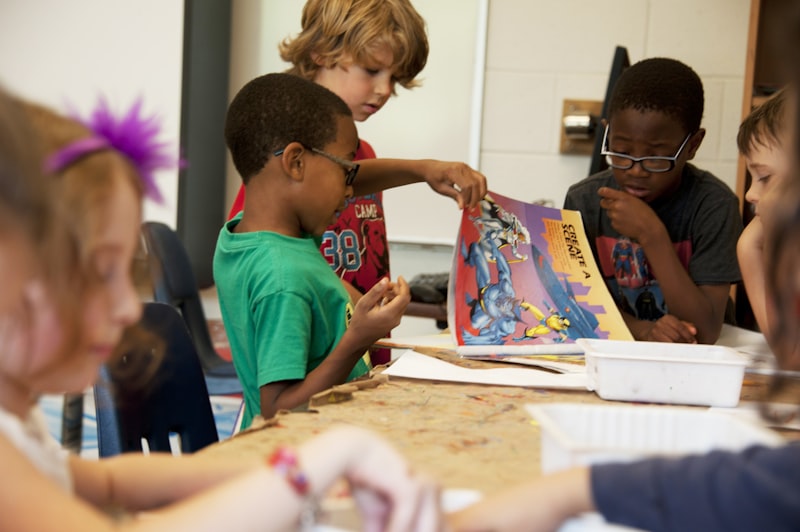
Cross-Curricular STEM Projects
Multi-day STEM projects allow students to experience how different subjects interconnect in authentic ways, mirroring real-world problem-solving.
Project: Build a Cardboard City (3-Day Project)
Day 1 - Research & Plan (Social Studies + Math)
Worksheet: City Planning

What buildings does a city need? (brainstorm):
☐ Houses         ☐ Stores        ☐ Schools
☐ Hospital       ☐ Fire station  ☐ Park
☐ Other: _______

Our city will have:
- ___ houses
- ___ stores
- ___ public buildings

City map sketch:
[Grid for planning layout]

Math calculations:
If each building is 10 cm × 10 cm, how much space do we need?
Total area: _____ cm²
Day 2 - Build (Engineering + Art)
Worksheet: Building Log

Building I'm creating: __________
Materials: ___________________
Height: ____ cm  |  Width: ____ cm

Design features (art):
- Colors used: ___________
- Decorations: ___________

Engineering challenges:
- Problem I faced: ___________
- How I solved it: ___________
Day 3 - Present (Communication + Science)
Worksheet: City Presentation

Our city's name: __________

Special features:
1. ___________________
2. ___________________
3. ___________________

Science connection:
How did we make structures stable? ______________
What forces did we consider? (gravity, weight distribution)
_________________________________________________
Problem-Solving Worksheets
Real-world problems provide the most meaningful context for STEM learning. Students develop agency and see themselves as change-makers.
Challenge: Reduce Plastic Waste at School
STEM Problem-Solving Worksheet

IDENTIFY THE PROBLEM:
Current situation: Our school uses 500 plastic water bottles/week
Environmental impact: _________________________

BRAINSTORM SOLUTIONS:
Idea 1: _____________________
Idea 2: _____________________
Idea 3: _____________________

CHOOSE BEST SOLUTION:
We will: ____________________
Because: ____________________

DESIGN THE SOLUTION:
Sketch your plan:
[Drawing box]

Materials needed: ___________
Cost estimate: $__________

TEST & EVALUATE:
After 1 week, how many plastic bottles used? ____
Did our solution work? ☐ Yes ☐ No ☐ Partially

Data analysis:
Before: 500 bottles/week
After: ___ bottles/week
Reduction: ___ bottles (___%)

IMPROVE:
What would you change to improve results?
_________________________________________________
🌍 Real-World Skills
- Problem identification and analysis
- Creative solution design
- Data collection and analysis
- Iterative improvement
- Environmental awareness
- Social responsibility
Assessment: STEM Rubric
Effective STEM assessment evaluates both the hands-on work and the documentation, providing a holistic picture of student learning.
STEM Project Rubric

ENGINEERING (Design & Build):
4 = Design meets all requirements, creative solution
3 = Design meets most requirements
2 = Design meets some requirements
1 = Design does not meet requirements

SCIENTIFIC THINKING (Testing & Data):
4 = Clear hypothesis, accurate data, thoughtful analysis
3 = Hypothesis and data present, some analysis
2 = Hypothesis or data present, limited analysis
1 = Missing hypothesis, data, or analysis

MATHEMATICS (Measurement & Calculations):
4 = Accurate measurements, correct calculations
3 = Mostly accurate, minor errors
2 = Some accuracy issues
1 = Significant measurement/calculation errors

ART/CREATIVITY (STEAM only):
4 = Highly creative, aesthetically pleasing
3 = Some creativity, acceptable appearance
2 = Limited creativity
1 = No creative elements

DOCUMENTATION (Worksheets):
4 = Complete, detailed, clear communication
3 = Mostly complete, adequate detail
2 = Incomplete, limited detail
1 = Missing significant documentation

TOTAL: ___/20 points (or ___/16 without Art)
💰 Pricing for STEM/STEAM Integration
Core Bundle Includes:
- ✅ Engineering design worksheets (planning, documentation)
- ✅ Data collection templates (measurement, graphing)
- ✅ Scientific method forms (hypothesis, testing, conclusions)
Time Savings Calculation
STEM project documentation: 20 projects/year × 3 worksheets each = 60 forms
Manual creation: 60 × 30 min = 1,800 min (30 hours)
With generators: Custom templates in minutes
Time saved: 28+ hours/year
Conclusion
STEM and STEAM integration represents a fundamental shift from isolated subject teaching to interconnected, authentic learning experiences. Research consistently demonstrates that integrated STEM instruction improves problem-solving by 25-35% compared to traditional approaches (Becker & Park, 2011).
🎯 Key Takeaways
- Engineering design: 5-step process (Ask, Imagine, Plan, Create, Improve) documented on worksheets provides structure for hands-on projects
- Math integration: Measurement, data collection, graphing, and analysis make math relevant and purposeful
- Science integration: Hypothesis testing, scientific method, variables, and evidence-based conclusions develop scientific thinking
- Technology: Algorithm design, coding logic, debugging, and sequencing build computational thinking
- Art (STEAM): Balancing function with aesthetics creates more innovative, user-centered designs
- Cross-curricular projects: Multi-day builds integrate all subjects authentically
- Problem-solving: Real-world challenges develop agency and application skills
- Assessment: STEM rubrics evaluate engineering, science, math, art, and documentation holistically
💡 Remember: Worksheets Support, Don't Replace
Every STEM project needs documentation—worksheets connect theory to hands-on practice. They serve as planning tools, data collection instruments, and reflection mechanisms that deepen learning without diminishing the hands-on experience.
Ready to Transform Your STEM Teaching?
Save 28+ hours per year on STEM documentation while improving student problem-solving by 25-35%
Research Citations
1. Becker, K., & Park, K. (2011). "Effects of integrative approaches among science, technology, engineering, and mathematics (STEM) subjects." Journal of STEM Education, 12(5), 23-37.
Key Finding: Integrated STEM instruction improves problem-solving by 25-35% compared to traditional siloed subject teaching.
2. Maeda, J. (2013). "STEM + Art = STEAM." The STEAM Journal, 1(1), Article 34.
Key Finding: Art integration in STEM develops creativity, design thinking, and innovation—critical skills for 21st-century careers.